The Super El Niño Question
Why 2026 Might Sustain Into Super Territory — or Peak Like 2023–24 and Fade. The Five Drivers, the Sustainability Test, and What It Means for India.
As of May 26, 2026“Maybe we’ve spent so much time and effort trying to figure out our place in this universe that we forgot — our place is here.”
— Cooper, Interstellar
NOAA Just Made Super El Niño the Central Case
On May 14, 2026, NOAA’s Climate Prediction Center upgraded its ENSO Alert Status to El Niño Watch and pushed emergence probability to 82% for May–July 2026 and 96% for the December 2026–February 2027 peak window. More consequentially, the CPC now puts the probability of a strong or very strong event at roughly 65%, with near-equal odds (around 25% each) of “very strong,” “strong,” or “moderate” outcomes at the peak. In plain language: a Super El Niño — Niño 3.4 anomalies exceeding +2.0°C — is now the single most likely peak-strength outcome for late 2026 into early 2027.
This is a meaningful upgrade. The April 9 advisory had emergence at 61% and strong-event probability at 33%. In five weeks, both numbers have jumped — emergence by 21 percentage points, strong-or-stronger by ~32 percentage points. The ECMWF ensemble, which had been the bullish outlier, has effectively dragged the official forecast toward its position.
NCEI Global Annual Temperature Rankings Outlook · 2026 Probability Distribution
From NCEI’s statistical simulation (10,000 runs based on monthly variance in the historical record), the probability distribution for where 2026 will finish in the all-time ranking:
The analytical point: NCEI’s own model places 2026 at 4th-warmest as the modal outcome despite a developing El Niño that has not yet peaked. The Super El Niño peak — if it materialises — falls in Dec 2026–Feb 2027, with its warming signal propagating through global temperatures in 2027, not 2026. 2027, not 2026, is the year most likely to challenge the 2024 record if the Sustained Super scenario plays out.
The Ten Warmest Years on Record · 1850–2025
Every one of the ten warmest years on record has occurred since 2015. The top three are 2024, 2023, and 2025 — three consecutive years, in a unique compression of warming. 2026 year-to-date currently sits 5th-warmest YTD.
| Rank | Year | Anomaly (°C) | Era Context |
|---|---|---|---|
| 1 | 2024 | +1.26°C | Tail end of 2023–24 Strong El Niño |
| 2 | 2023 | +1.17°C | 2023–24 Strong El Niño development |
| 3 | 2025 | +1.12°C | La Niña, yet still 3rd-warmest ever |
| 4 | 2020 | +1.01°C | Post-2018–20 Triple La Niña start |
| 5 | 2016 | +1.00°C | Tail of 2015–16 Super El Niño |
| 6 | 2019 | +0.99°C | Weak El Niño / strong +IOD |
| 7 | 2017 | +0.93°C | Weak La Niña recovery |
| 8 | 2022 | +0.89°C | Mid-Triple La Niña year |
| 9 | 2015 | +0.88°C | 2015–16 Super El Niño development |
| 10 | 2018 | +0.87°C | End of Triple La Niña start |
| YTD | 2026 | +1.15°C Jan–Apr | Currently between rank 3 and rank 4 if held; El Niño developing |
The clustering is the point: nine of ten warmest years post-2015, top three years 2023–2025 consecutive. Background warming has compressed the distance between baseline and Super-event temperatures — making the ONI vs RONI distinction operationally significant for any forward analysis.
El Niño 2026 Probability — Evolution Across NOAA Updates
| Forecast Date | El Niño Emergence | Strong (≥+1.5°C) | Super (≥+2.0°C) | Peak Window Niño 3.4 max strength |
Move |
|---|---|---|---|---|---|
| March 13, 2026 | 62% | 17% | — | Oct–Dec 2026 (NH winter) |
Baseline |
| April 9, 2026 | 61% | 33% | ~13% | Nov 2026–Jan 2027 (NH winter) |
↑ Strong +16pts |
| May 14, 2026 | 82% | ~65% | ~25% | Dec 2026–Feb 2027 (NH winter peak) |
↑↑ +21 / +32pts |
| June 11, 2026 | Post-spring barrier — the key resolution point for intensity | ||||
Source: NOAA CPC ENSO Diagnostic Discussions, March 13 / April 9 / May 14, 2026. IRI ENSO Plume May 21, 2026. Skymet Weather May 23, 2026.
Ten Drivers, Where They Stand, What History Says
The May 14 upgrade reflects ten distinct physical and atmospheric factors interacting on different timescales. Some are achieved and locked in. Some are partial and resolving. Some are entirely lacking and may never establish. The next four elements decompose this into the analytical components: a causal map of how El Niño forms, a 2×2 driver matrix showing current state, a master scorecard with historical context, and a hit-rate strip comparing the current cycle to past Super events. Two methodological caveats first: the historical Super El Niño sample is small (six events since 1950), so hit-rates are indicative, not statistically conclusive. And the standard ONI index — which much of the public discussion uses — runs warmer in a warmer baseline ocean. The Relative ONI (RONI) strips this out and gives a more honest read on physical strength; where the two diverge, RONI is the better signal.
A. The Causal Chain — From Subsurface Heat to Sustained El Niño
The Bjerknes feedback is the physical mechanism that turns an oceanic warm anomaly into a sustained El Niño. Five sequential stages must succeed: subsurface heat reservoir, trigger event, surface threshold crossing, atmospheric coupling, and feedback lock-in. The first three are achieved in May 2026. The fourth is in progress. The fifth — the lock-in — is the resolution point for the next 90 days.
B. Driver Matrix — Direction vs Current State
Each driver positioned by what it does to El Niño (strengthen vs weaken on the horizontal axis) and whether it is currently active or absent (vertical axis). The top-right quadrant is the engine fuelling the May upgrade. The bottom-right is the sustainability gap — the strengthening factors that have not yet established. Whether the dots in the bottom-right migrate upward by July–August determines which scenario from Section 03 plays out.
C. Master Scorecard — Ten Factors
The full operational checklist. For each factor: the physical mechanism, the direction it pushes (strengthen / weaken / modulator), its historical significance based on the Super El Niño track record, the current cycle state, the statistical weight of evidence, and whether it remains an active watch point.
| Factor | Mechanism | Direction | Historical Significance | Current State | Weight | Watch |
|---|---|---|---|---|---|---|
| Subsurface Heat Western Pacific warm pool, 0–300m |
Energy reservoir; without it, surface anomalies cannot sustain | ↑ Strengthen | Present in 6/6 sustained Super events. Absent in 2009 weak event. | ✓ Achieved +6°C at 50–150m; 2× May 2023 reading |
HIGH | Passive |
| Kelvin Wave Activity Downwelling subsurface pulse |
Mechanism that transports subsurface heat eastward to surface | ↑ Strengthen | Multiple downwelling Kelvin waves preceded 1997 and 2015 events. 2023 had one strong pulse; 2014 had several stalled by easterlies. | ✓ Achieved April twin-cyclone trigger; pulse now reaching E. Pacific |
HIGH | Passive |
| Niño 3.4 Surface Threshold +0.5°C SST anomaly |
Defines El Niño onset; sustained reading classifies the event | ↑ Strengthen | By definition all Super events crossed and held this. 2014 crossed and retreated. | ✓ Achieved +0.5°C in May 2026; momentum upward |
HIGH | Active |
| Trade Wind Weakening Equatorial easterlies relaxing |
Removes the upwelling that brings cool water to surface; allows warm pool to spread east | ↑ Strengthen | Decisive weakening in 1997, 2015. Partial-only in 2023 (event peaked then faded). Absent in 2014 (event stalled). | ◐ In Progress Partial weakening; not yet decisive |
HIGH | ACTIVE |
| Southern Oscillation Index Tahiti–Darwin pressure difference |
Atmospheric response signal; sustained negative SOI confirms coupling | ↑ Strengthen | Sustained below −0.5 in all 6 Super events. 2023 reached −0.3 then stalled. 2014 never sustained negative. | ◐ In Progress −0.3 in April 2026; needs to extend lower |
HIGH | ACTIVE |
| Bjerknes Feedback Lock-In Self-reinforcing ocean–atmosphere coupling |
The mechanism that turns an event from triggered into sustained; without it, peak-and-fade is the default | ↑ Strengthen | Locked in for 1997, 2015. Failed in 2014 and arguably 2023 (despite hitting +2.0°C). | ✗ Lacking Not yet established; resolves Jun–Aug |
HIGH | ACTIVE |
| Westerly Wind Burst Continuation Further WWB events through Jul–Aug |
Each additional WWB reinforces the warm pool’s eastward propagation | ↑ Strengthen | Multiple WWBs in 1997 (4+) and 2015 (3+). Only one decisive WWB in 2023. None of significance in 2014 after the initial trigger. | ✗ Lacking No follow-on WWBs since April pulse |
HIGH | ACTIVE |
| MJO Amplitude & Phase Madden–Julian Oscillation in phases 4–6 |
Active MJO in W. Pacific phases generates WWBs and sustains atmospheric forcing | ↑ Strengthen | Strong MJO in W. Pacific contributed to 1997 and 2015 development. MJO stalled in 2014 (basinwide). 2023 MJO weakened mid-cycle. | ◐ In Progress Unstalled; propagating Maritime → W. Pacific |
MED | ACTIVE |
| Indian Ocean Dipole DMI — west vs east equatorial Indian SST |
Modulator: positive IOD reinforces El Niño’s drying effect on Asia; negative IOD can offset it entirely | ↔ Modulator | Strongly positive IOD in 2019 (no El Niño) and 2023 amplified drying. Strongly negative IOD in 1997 produced normal India monsoon despite Super El Niño. | ◐ Neutral DMI −0.16°C, neutral 7 weeks |
HIGH for India | ACTIVE |
| Atlantic Niño / TNA Warmth Tropical North Atlantic SST anomaly |
Warm Atlantic drives Walker Circulation response that suppresses Pacific El Niño | ↓ Weaken | Warm Atlantic contributed to 2014 stall. Cool/neutral Atlantic permitted 1997 and 2015 to sustain. 2023 also had warm Atlantic. | ⚠ Present Atlantic remains warm; multi-year trend |
MED | ACTIVE |
D. Historical Hit-Rate — Factor Presence Across Past Events
For each high-weight factor, presence or absence in nine reference events: six Super El Niños (1957, 1972, 1982, 1991, 1997, 2015) and three notable failures or partial events (1990 stalled, 2014 deferred, 2023 peaked-and-faded). The “hit-rate” comparison — how often a factor was present in sustained Super events versus failed events — gives a directional read on which factors matter most. The sample is small, so this is indicative rather than statistically authoritative; treat any ratio as a hypothesis to test against the 2026 cycle, not as proof.
| Factor | SUSTAINED SUPER EVENTS | FAILED / PARTIAL EVENTS | 2026 | Hit Rate | |||||||
|---|---|---|---|---|---|---|---|---|---|---|---|
| ’57 | ’72 | ’82 | ’91 | ’97 | ’15 | ’90s | ’14d | ’23p | current | ||
| Strong Subsurface Heat | ✓ | ✓ | ✓ | ✓ | ✓ | ✓ | ✓ | ✓ | ✓ | ✓ | 6/6 sup · 3/3 fail Necessary, not sufficient |
| Multiple Kelvin Waves | ✓ | ✓ | ✓ | ~ | ✓ | ✓ | ~ | ~ | ~ | ~ | 5/6 sup · 0/3 fail Strong predictor |
| Decisive Trade Wind Weakening | ✓ | ✓ | ✓ | ~ | ✓ | ✓ | ✗ | ✗ | ~ | ~ | 5/6 sup · 0/3 fail Strongest discriminator |
| SOI Sustained Below −0.5 | ✓ | ✓ | ✓ | ✓ | ✓ | ✓ | ✗ | ✗ | ~ | ~ | 6/6 sup · 0/3 fail Strongest discriminator |
| Bjerknes Feedback Lock-In | ✓ | ✓ | ✓ | ✓ | ✓ | ✓ | ✗ | ✗ | ✗ | ✗ | 6/6 sup · 0/3 fail Defines the difference |
| Multiple WWBs Through Summer | ✓ | ~ | ✓ | ~ | ✓ | ✓ | ✗ | ✗ | ✗ | ✗ | 4/6 sup · 0/3 fail Indicative |
| MJO in W. Pacific Phases 4–6 | ~ | ✓ | ✓ | ~ | ✓ | ✓ | ✗ | ✗ | ~ | ~ | 4/6 sup · 0/3 fail Supporting evidence |
| Cool / Neutral Atlantic | ✓ | ✓ | ✓ | ~ | ✓ | ~ | ✗ | ✗ | ✗ | ✗ | 4/6 sup · 0/3 fail Permissive condition |
| Negative IOD (India offset) | ~ | ✗ | ✗ | ✗ | ✓ | ✗ | ~ | ✗ | ✗ | ✗ | 1/6 sup · 0/3 fail Modifier only, India-specific |
✓ Present · ~ Partial / mixed evidence · ✗ Absent · ’57 = 1957–58 · ’72 = 1972–73 · ’82 = 1982–83 · ’91 = 1991–92 · ’97 = 1997–98 · ’15 = 2015–16 · ’90s = 1990–93 stalled · ’14d = 2014 deferred to 2015–16 · ’23p = 2023–24 peaked-and-faded
Will 2026 Sustain or Peak Like 2023–24?
Subsurface heat tells you an El Niño can form. It does not tell you it will sustain. The 2023–24 event is the cautionary tale: it peaked at +2.0°C — technically at the Super threshold but classified Strong — and then collapsed faster than the historical pattern. The Bjerknes feedback never fully locked in. Trade winds did not weaken decisively. Atmospheric response stayed partial. The event ran out of energy by spring 2024, well short of the duration of 1997–98 or 2015–16.
An even cleaner analogue exists earlier. In 2014, the subsurface signal at this stage looked roughly comparable to 2026. A strong easterly wind burst in June 2014 discharged the basin, suppressed the Bjerknes feedback, and stalled what looked like a developing Super event. The energy did not vanish — it reorganised — and the actual Super El Niño arrived in 2015–16 instead. Translation: large subsurface heat is necessary but not sufficient; the wrong wind event in June can defer the whole sequence by a year.
The right framing for the next 6–10 weeks is therefore: three scenarios, each with a distinct precedent.
| Scenario | Probability | Peak Niño 3.4 | Historical Analogue | What Has to Happen |
|---|---|---|---|---|
| Scenario ASustained Super | 30% | +2.0 to +2.5°C | 1997–98 (+2.4°C), 2015–16 (+2.6°C) | Trade winds weaken decisively by July. Bjerknes feedback locks in. Further westerly wind bursts reinforce downwelling. SOI sustains below −0.5. RONI catches up to ONI. |
| Scenario BSharp Peak, Fast Decay | 40% | +1.8 to +2.1°C | 2023–24 (peaked +2.0°C, classified Strong) | Subsurface energy spends itself reaching the surface. Atmospheric coupling stays partial. Peak arrives Oct–Dec 2026 but the event lacks the wind feedback to sustain. La Niña develops by mid-2027. |
| Scenario CStalled, Deferred to 2027–28 | 25% | +0.8 to +1.4°C this cycle | 2014 (deferred to 2015–16) | A strong easterly wind burst in June–July discharges the warm pool. Surface anomaly stalls in moderate territory. The real Super event arrives one cycle later. |
| Scenario DUnderperform / Fizzle | 5% | +0.5 to +0.8°C | 2017–18 weak event | Coupling fails to establish at all. The signal stays oceanic. Reverts to neutral by Q1 2027. |
Why the Super El Niño Probably Misses the Monsoon — Mostly
The cleanest insight buried inside the May 14 NOAA strength probabilities is this: the Super phase comes after the monsoon ends. NOAA’s seasonal distribution shows the Indian summer monsoon (June–September) will begin with a 70% probability of weak El Niño conditions, 10% moderate, and 20% ENSO-neutral. The peak intensification — strong-to-very-strong probabilities of 40% — comes only in the closing weeks of the monsoon and the post-monsoon months. The very strong phase is most likely after September.
This is consequential. The historical relationship between El Niño peak strength and Indian monsoon outcome is weaker than the popular narrative assumes. Of the six Super El Niño events since 1950 (1957–58, 1972–73, 1982–83, 1991–92, 1997–98, 2015–16), the monsoon record was: two normal, one below normal, two moderate drought, one severe drought. Skymet documents 1997–98 — the strongest event on record at +2.4°C — produced 102% of LPA, an entirely normal monsoon. 1957–58 also produced 98% of LPA. The 1972 event produced 76% of LPA and a severe drought. The same peak strength can produce opposite monsoon outcomes.
| Super El Niño | Peak Niño 3.4 | India Monsoon | % of LPA | Outcome Class |
|---|---|---|---|---|
| 1957–58 | +1.8°C | Near-normal | 98% | Normal |
| 1972–73 | +2.3°C | Severe drought | 76% | Severe Drought |
| 1982–83 | +2.5°C | Below normal | 85% | Below Normal |
| 1991–92 | +1.7°C | Moderate drought | 91% | Below Normal |
| 1997–98 | +2.4°C | Normal | 102% | Normal |
| 2015–16 | +2.6°C | Moderate drought | 86% | Below Normal |
The IMD’s April 13 forecast captures this nuance correctly. Headline: 92% of LPA, slightly below normal. Probability of a deficient season (below 90% of LPA): 35%, more than double the climatological base rate of 16%. But the IMD also forecasts an early Kerala onset window of May 22–30, against a typical onset of June 1. Skymet broadly concurs. Early onset is not the same as adequate seasonal total — the two are weakly correlated — but the early-onset signal does suggest the South Asian monsoon system is energised at the start, even with El Niño in the background.
The geographical distribution matters more than the headline number. Northern and central states (Punjab, Haryana, Rajasthan, UP, MP) carry the highest risk, especially in the back half of the season as El Niño coupling strengthens. Southern states (TN, Karnataka, Kerala, AP, Telangana) are expected to receive near-normal rainfall, which substantially limits the headline drought risk and protects southern kharif production. The north–south divergence is the dominant analytical fact for the 2026 monsoon — not the El Niño strength itself.
| Monsoon Phase | NOAA Strength Distribution | India Implication |
|---|---|---|
| Onset · Jun 2026 | 70% weak El Niño · 10% moderate · 20% neutral | Permissive of normal Kerala onset (May 22–30 window). Pre-monsoon already normal-to-above-normal in most regions. |
| Mid-Season · Jul–Aug | Equal share weak and moderate El Niño | Risk window for back-loaded deficits. Northern/central states most exposed. Southern monsoon likely intact. |
| Close · Sep 2026 | ~40% strong or very strong El Niño | End-season weakening probable. Affects late kharif and rabi sowing more than core monsoon production. |
| Post-Monsoon · Oct–Dec | Peak Super El Niño window (25–30%) | NE monsoon (TN, coastal AP) affected. Reservoir refill timing matters for rabi. |
Food Inflation Is the Channel That Matters
India’s macro position going into the 2026 monsoon is meaningfully tighter than going into the 2015 monsoon. CPI inflation has been above the RBI’s 4% target through most of FY26, food inflation specifically has been the persistent contributor, and household balance sheets remain weaker post-pandemic. The 2015–16 Super El Niño produced a moderate drought (86% of LPA) and rural distress visible in FMCG volumes — HUL and Dabur both reported rural-led volume contractions. The same set-up exists in 2026, with one key difference: reservoir levels at 44.6% of live capacity are above the 10-year average, and government grain stocks remain adequate after two La Niña years. The drought risk transmission to actual food supply is buffered. The transmission to food prices is not.
Food inflation is the channel to focus on. Even a moderately below-normal monsoon with localised deficits in the northern grain belt is sufficient to push pulses, oilseeds, and select vegetable prices materially higher in the second half of CY26. The 2023 sugar episode is the cleanest recent example — Indian production fell roughly 8% on uneven monsoon distribution despite acceptable headline totals, and domestic sugar prices rose sharply, contributing visibly to CPI food. The same dynamic is possible across multiple kharif categories in 2026, and the timing — peak food inflation potentially landing in October–December 2026 — coincides with the strongest El Niño phase and pre-Budget political sensitivity. This is the channel the bond market and the RBI will be watching.
For equity positioning, the implications extend Part II’s Markets framework. Rural-exposed FMCG (HUL, Dabur, Marico in the most rural-skewed categories), rural-skewed NBFCs (Mahindra Finance, Cholamandalam in tractor and used-CV financing), and two-wheelers (Hero, Bajaj Auto entry segments) carry the most direct downside if rural sentiment weakens through Q3. Conversely, the irrigation and agri-input cluster (PI Industries, Coromandel, UPL) and sugar (Balrampur, Triveni, Dwarikesh) benefit from the same disruption — the latter as a price-driven thesis, not a volume one. Utilities with hydroelectric exposure (NHPC, JSW Energy) face mild headwinds from reservoir drawdowns, but this is a smaller signal than the rural consumption complex.
The Compressed Pacific
If 2026 follows Scenario B and peaks Strong-but-not-sustained like 2023–24, it confirms a pattern that has been visible since roughly 2015: the structural lengthening of ENSO has shortened. The traditional 12–18 month neutral windows between events have compressed to 6–9 months. Multi-year La Niñas have become more common (2020–2023 was the first triple-dip in 50 years). And Super-strength surface anomalies are emerging more easily because the baseline ocean is warmer, but they sustain less reliably because the Bjerknes feedback — which depends on east-west temperature gradients — appears to be weakening as the basin warms more uniformly.
The implication for forecasters is uncomfortable: predictability gets harder, not easier, even with better models and more observation. Easier emergence + harder sustainability means more events but more variance in their outcomes. For markets exposed to ENSO — agri commodities, insurance, certain utilities, Indian rural FMCG — this means the strategic question is shifting from “what will the next El Niño do?” to “how compressed is the cycle, how often will events happen, and how reliably can we distinguish a 1997-style sustained event from a 2023-style peak-and-fade?” The Climate & Markets framework in this series is built around exactly that question.
What to Watch — Next 8 Weeks
The next 8 weeks resolve which scenario gets the highest weight. Six specific data points determine whether the central case shifts toward Scenario A (Sustained Super), B (Peak-and-Fade), or C (Stalled and Deferred).
Key Data Releases & Indicators · Through July 2026
- Jun 11, 2026NOAA ENSO Diagnostic Discussion — first post-spring-barrier reading. The single most important update for intensity.
- Jun 15, 2026IMD second-stage Monsoon Forecast — refined LPA estimate with geographical distribution; first hard read on monsoon performance.
- Jun 20–25, 2026Kerala onset confirmation — the window IMD has flagged; early onset preserves the optionality of a normal-to-near-normal season.
- Jun–Jul 2026Trade wind data (weekly SOI, equatorial westerly wind anomalies) — the binary test for whether the Bjerknes feedback is locking in or stalling. A strong easterly burst this window pushes weight toward Scenario C.
- Jul–Aug 2026Indian Ocean Dipole trajectory — DMI breaking decisively positive favours a normal monsoon despite El Niño; breaking negative compounds the suppression. The IOD path is the largest controllable uncertainty for the India call.
- Aug 14, 2026NOAA August Diagnostic Discussion — peak-strength probability distribution should sharpen meaningfully; provides the read for Q4 positioning.
Sources & References
All data points and analytical claims in this piece are sourced from publicly available official meteorological reports and forecasts. Hyperlinks provided to original sources for direct verification.
- NOAA Climate Prediction Center — ENSO Diagnostic Discussion (May 14, 2026)
The official ENSO Watch upgrade. Source for 82% emergence probability, 96% Dec 2026–Feb 2027 peak probability, ~65% strong-or-stronger by October.
cpc.ncep.noaa.gov/products/analysis_monitoring/enso_advisory/ensodisc.shtml - NOAA Climate Prediction Center — Official ENSO Probabilities Table
Source for ENSO strength probability distribution by season and the RONI-based forecast.
cpc.ncep.noaa.gov/products/analysis_monitoring/enso/roni/probabilities.php - IRI/Columbia University — May 2026 ENSO Quick Look (May 21, 2026)
Subsurface heat content readings (2× May 2023 reading, +6°C anomalies at 50–150m), SOI at −0.3, IOD trajectory, model plume probabilities (98% El Niño May–Jul through MJJ 2026 → JFM 2027).
iri.columbia.edu/our-expertise/climate/forecasts/enso/current/ - Skymet Weather — “How Strong Will El Niño Be: Likely Impact on Monsoon” by AVM GP Sharma (May 23, 2026)
Source for NOAA strength probability distribution across the Indian summer monsoon period (70% weak / 10% moderate / 20% neutral at onset; 40% strong/very strong by close); historical Super El Niño / monsoon record; IOD posture analysis; MJO propagation; “fastest pace of warming this century” framing.
skymetweather.com/content/la-nina/how-strong-will-el-nio-be-likely-impact-on-monsoon - India Meteorological Department — First-Stage Long Range Monsoon Forecast (April 13, 2026)
Source for 92% of LPA seasonal forecast, 35% probability of deficient season, north–south distribution profile, Kerala onset window.
mausam.imd.gov.in - NOAA NCEI — Global Climate Report, April 2026 (released May 2026)
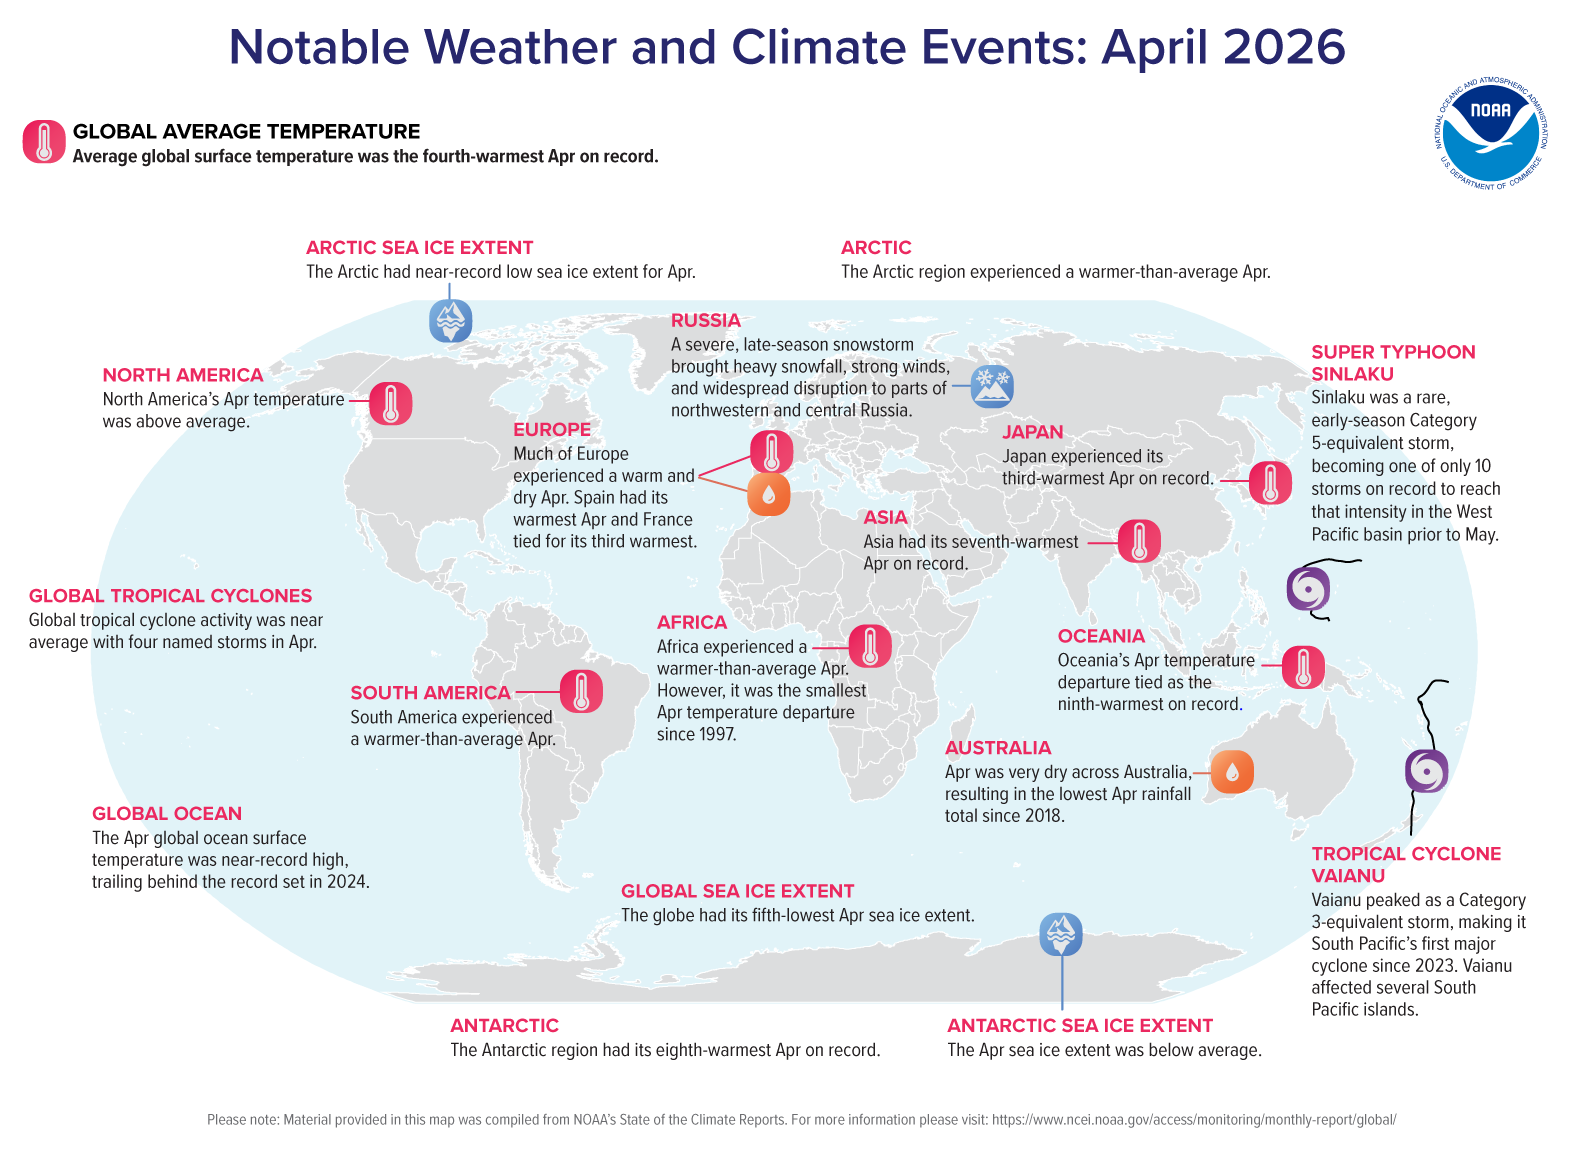
Source for April 2026 fourth-warmest ranking (+1.12°C), January–April fifth-warmest (+1.15°C), global ocean second-warmest April (+0.95°C), Arctic second-smallest April sea ice, Southern Hemisphere ocean highest April on record, regional anomalies.
ncei.noaa.gov/access/monitoring/monthly-report/global/202604
ncei.noaa.gov/news/global-climate-202604 - NOAA NCEI — 2026 Global Annual Temperature Rankings Outlook (April 2026)
Source for the 2026 ranking probability distribution: 60.7% chance of 4th-warmest as modal outcome, 96.1% chance top-5, >99.9% chance top-10. 10,000-run statistical simulation methodology.
ncei.noaa.gov/access/monitoring/monthly-report/global/202604 - The Conversation — “A ‘super El Niño?’ Why it’s too early to forecast one with certainty” (May 2026)
Source for the April twin-cyclone Kelvin wave trigger description, RONI vs ONI methodology, subsurface coupling caveats, and the model overconfidence caveat.
theconversation.com/a-super-el-nino-why-its-too-early-to-forecast-one-with-certainty - NOAA Coral Reef Watch — ENSO Current Conditions Archive (April 2026 reading)
Source for April 9 NOAA advisory baseline: 80% ENSO-neutral through Apr–Jun, transition thereafter, 1-in-4 chance of very strong winter.
coralreefwatch.noaa.gov/satellite/analyses_guidance/enso_current_conditions.php - Nature Communications — “Sensitivity of El Niño intensity and timing to preceding subsurface heat magnitude” (Ballester et al., 2016)
Source for the 2014 stall analogue mechanism and the necessary-but-not-sufficient framing of subsurface heat content.
ncbi.nlm.nih.gov/pmc/articles/PMC5093742 - NOAA CPC — ENSO Evolution, Status and Predictions Update (May 2026)
Source for the historical context of warm water volume anomalies and downwelling Kelvin wave development since December 2025.
cpc.ncep.noaa.gov — ENSO Evolution PDF - NOAA CPC — Global Ocean Monitoring (GODAS)
Source for ocean heat content fields and Warm Water Volume / Niño 3.4 phase diagrams referenced in the subsurface analysis.
cpc.ncep.noaa.gov/products/GODAS
This analysis is for informational and research purposes only. Not investment advice. All probability estimates in Section 03 are analytical judgements based on the cited official sources, and reflect the author’s interpretation of the published data rather than the official position of any of the agencies cited. ENSO forecasting carries inherent uncertainty, particularly through the spring predictability barrier (May–June), and probability distributions are expected to sharpen significantly with the June 11 and August 14 NOAA updates. Fenrir Research is not affiliated with NOAA, IRI, IMD, or Skymet.
Fenrir Research · a division of Yggdrasil Ledger · Climate & Markets Series · Part III
Leave a Reply